Understanding how markets behave can feel like trying to solve a complex puzzle. The pieces—like consumer confidence, GDP growth, and employment trends—are all interconnected, yet elusive on their own. Analysts sift through layers of data and economic indicators to uncover hidden trends that shape our financial landscape.
Let’s dive into the fascinating world of macroeconomic analysis and discover how experts are unraveling these intricate patterns.
Analyzing Economic Activity
Macroeconomic analysts assess economic health by analyzing various indicators that reflect the underlying activities within a nation’s economy. Through meticulous examination of data, they look at different sectors such as production, consumption, and labor markets. These measurements aren’t just numbers; they tell stories about how people are interacting within the economy. For instance, when analysts investigate metrics like GDP (gross domestic product), employment rates, and industrial production indices, they gain insights into the robustness of economic conditions.
Understanding GDP
At its core, GDP measures the total value of all goods and services produced within a country during a specific timeframe, effectively acting as a snapshot of economic output. Changes in GDP can indicate whether an economy is thriving or struggling. Analysts track these shifts closely because an increase in GDP generally signals economic growth—fueled by factors like heightened consumer spending or increased business investments. For example, the U.S. experienced a notable GDP growth rate of 2.8% in the first quarter of 2025, suggesting a dynamic economy buoyed by flourishing consumer demand and robust business investments.
This leads us to another critical component of economic analysis: employment trends.
Employment Trends
Employment data serves as a crucial lens through which analysts can examine the labor market’s overall well-being. One particularly telling statistic is the unemployment rate, which reflects the proportion of the labor force that is unemployed yet actively seeking work. In April 2025, for instance, the U.S. witnessed a drop in the unemployment rate to 3.5%. While this figure may suggest a healthy labor market, analysts must dig deeper; stagnant wage growth can indicate potential issues lurking beneath the surface, such as underemployment.
When we weave together insights about GDP and employment data, we gauge immediate economic performance while identifying underlying trends that call for attention from policymakers and stakeholders alike.
By closely monitoring these dual layers of economic activity—output via GDP and human engagement through employment—macro analysts are able to provide insightful forecasts for companies planning investments or consumers making spending decisions. This intricate dance between various indicators illustrates how interconnected elements shape our economy’s future trajectory.
With these foundational concepts established, we can now explore more specialized tools and metrics that further illuminate macroeconomic landscapes.
Related Article: The Importance of Economic Research in Policy Making
Key Macroeconomic Indicators
Leading, lagging, and coincident indicators each play a vital role in understanding the economy’s trajectory. It’s important to recognize how they interact with each other to paint a comprehensive picture of economic health and performance.
Leading Indicators
Leading indicators are crucial as they provide foresight into where the economy might be headed. They allow analysts to anticipate changes before they manifest in the broader economy. A prime example is the Consumer Confidence Index (CCI), which captures how optimistic households feel about their financial future. When consumer confidence rises, it often correlates with increased spending, which can subsequently fuel economic growth.
In March 2025, the CCI soared to 134.7, indicating that consumers are likely to open their wallets and spend more in the coming months. This spending typically stimulates various sectors, from retail to services, ultimately having a cascading effect on job creation and overall economic vitality.
Initial jobless claims represent another leading indicator that signals potential changes in the labor market. A rise in claims suggests that businesses could be scaling back their workforce due to anticipated decreases in demand. Conversely, decreasing claims indicate robustness in employment sectors, hinting at an expanding economy.
Lagging Indicators
Turning to lagging indicators, we see how they provide confirmation of trends already established. These metrics help analysts verify whether certain actions have resulted in expected outcomes. The unemployment rate is one such lagging indicator; it reflects the health of the job market after economic shifts have occurred.
As of the first quarter of 2025, the annual GDP growth rate stands at 2.8%. This figure helps us understand economic performance following specific events or trends. If GDP shows improvement post-recessionary periods, we can confidently conclude that recovery efforts may be effective.
While lagging indicators confirm what has been experienced, they should be interpreted carefully; they often report too late for businesses and policymakers to act preemptively. Therefore, they should always be considered alongside leading indicators for a well-rounded view of the economy.
Coincident indicators fill this gap by providing real-time insights into current economic conditions.
Coincident Indicators
Coincident indicators such as industrial production and retail sales offer an instantaneous snapshot of economic activity. They reflect current conditions rather than predicting future movements or confirming past patterns. For instance, recent figures show that U.S. industrial production rose by 1.5% in February 2025.
This uptick indicates a strong manufacturing sector capable of responding to present-day demands, reflecting not just vibrant production capabilities but also underlying consumer and business confidence. Similarly, retail sales figures inform us about consumer behavior right now, effectively telling us whether shoppers are engaging with the market positively or negatively.
By diligently analyzing these key macroeconomic indicators, analysts create a framework for informed predictions that will lead us into our exploration of methodologies utilized in economic forecasting.
Forecasting Models and Techniques
Analysts employ a variety of forecasting models to predict market trends with a degree of accuracy. These quantitative methods often hinge on statistical algorithms and econometric techniques, providing a framework for analyzing complex economic data. The foundation of these models is built upon historical trends and patterns that help investors and businesses navigate future uncertainties.
Econometric Models
Econometric models are one of the cornerstones of economic forecasting. They are specifically designed to use historical data to forecast future economic activities. These models take into account regression analysis, where researchers explore causal relationships between various economic variables. For instance, they examine how changes in consumer spending may influence GDP growth.
An excellent illustration of this is the Phillips Curve, which captures the relationship between inflation and unemployment rates in an economy. By analyzing this relationship, analysts can predict inflationary trends based on current labor market conditions. If unemployment falls below a certain threshold, inflation may be expected to rise as more people have disposable income to spend.
Beyond econometric models, analysts also rely heavily on time-series analysis to examine past trends for better insights into future movements.
Time-Series Analysis
Time-series analysis examines patterns observed over sequential time data to identify trends and cyclical behaviors. Analysts use specific models like ARMA (AutoRegressive Moving Average) and ARIMA (AutoRegressive Integrated Moving Average) for their ability to forecast future values based on historical data. The beauty of time-series analysis lies in its coherence; it allows for continuous observation of data points unveiling cyclical patterns related to seasons, economic crises, or other significant events.
For example, if a company tracks monthly sales data over several years, it could use ARIMA modeling to effectively assess past performance and product demand trends—turning numbers into actionable insights for stock management or marketing strategies.
While econometric models and time-series analyses are critical for quantitative analysis, qualitative techniques play an equally pivotal role in rounding out predictive accuracy.
Qualitative Techniques
Qualitative techniques capture insights that quantitative data alone cannot provide. Methods such as the Delphi technique or expert panels leverage specialist knowledge to gather opinions about future trends. This process involves engaging with economists or industry experts through surveys or brainstorming sessions, allowing analysts access to real-world experiences that numbers sometimes fail to show.
For instance, researchers might conduct extensive surveys among leading economists to anticipate interest rate movements based on broad economic sentiments or emerging market challenges. Such qualitative insights create a richer picture when combined with robust statistical modeling.
Ultimately, effective forecasting often requires an integrated approach where qualitative insights bolster quantitative findings, producing a more nuanced understanding of market dynamics.
This multifaceted approach sets the stage for exploring the broader factors that shape market behavior and influence business decisions.
Influences on Market Trends
Economic policies are more than just a series of decisions made by governments; they form the backbone of market trends and consumer behavior. When central banks adjust monetary policy, such as lowering interest rates, it can have immediate ripple effects throughout the economy.
Imagine a homeowner faced with high borrowing costs making the decision to delay buying a new home. However, when interest rates drop, that same homeowner might feel empowered to purchase not just a house but also invest in renovations or furnishings. This act of borrowing leads to increased spending, stimulating other sectors. There’s a delicate balance to maintain, as expansive monetary policy can lead to inflation if left unchecked—a double-edged sword in economic management.
On the global stage, strides taken by individual nations can reverberate around the world.
Global Economic Events
International events shape market sentiment and economic stability significantly. For instance, take the tumultuous negotiations surrounding trade agreements—one small shift can cascade into larger economic repercussions. The geopolitical tensions we felt in 2024 serve as a stark reminder of this reality.
As countries grappled with supply chain disruptions due to conflicts overseas, businesses suddenly found themselves struggling to meet demand for goods that seemed readily available just months prior. Such scenarios illuminate the vulnerabilities within our global dependencies, painting a broader picture where single events can alter course trajectories for countless industries ranging from automotive to healthcare.
Yet it is not just external forces that prop up or hinder market progress; domestic activities also play vital roles.
Industry-Specific Trends
Within national boundaries, ongoing shifts within key sectors offer insights into broader economic landscapes.
Look at the technology sector—a juggernaut driving much of today’s economic growth. Innovations in areas like data analytics and artificial intelligence have not only contributed to market expansion but have revolutionized job categories, creating roles scarcely imagined just a few years ago. As companies adapt and grow in response to these advancements, we see a distinct movement within labor markets as workers pivot toward competencies aligned with emerging technologies.
Thus, understanding these industry-specific developments allows macroeconomic analysts to forecast changes with greater precision while aligning strategies tailored towards foreseeable economic adjustments.
By examining these interconnected influences—government policies, global events, and industry advancements—analysts are better positioned to understand market dynamics and anticipate future movements.

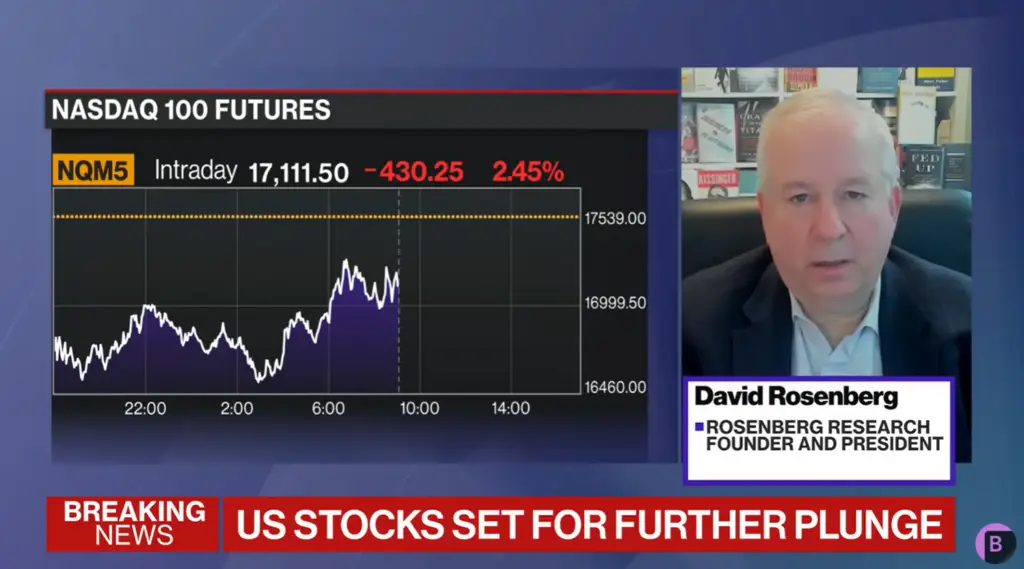
Leverage Expert Forecasting to Strengthen Your Investment Strategy
When markets turn volatile, strategic foresight becomes your most valuable asset. At Rosenberg Research, our macroeconomic analysts provide the clarity needed to navigate uncertainty with confidence. Through data-driven forecasts and nuanced trend analysis, we help financial professionals make smarter, forward-looking decisions.
Whether you’re advising clients on asset allocation or managing institutional risk, our research gives you the edge. Check out our free trial and experience how expert forecasting can elevate your investment strategy from reactive to resilient.